
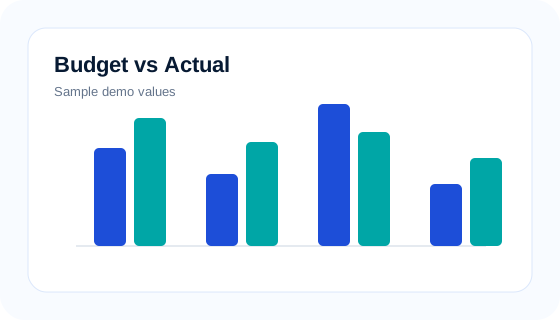
 Budget vs Actual Cost by Project
Compare approved budgets against actual project costs to identify overruns early, before they affect profitability or cash flow.
Budget vs Actual Cost by Project
Compare approved budgets against actual project costs to identify overruns early, before they affect profitability or cash flow.
Executive Summary Cards
Sample KPI cards for construction leaders
Use this section as a quick executive snapshot: project health, budget movement, profitability, invoices, RFIs, change orders, safety, equipment, and labor signals. Each card is clearly labeled as a sample demo value. A private client dashboard should calculate values from approved files, exports, reports, APIs, or structured data after metric definitions are confirmed.
Sample demo only
No real client information is displayed.
Active Projects
18
Sample demo value
Projects currently monitored in the sample portfolio.
Portfolio Risk
Medium
Sample demo value
Sample risk based on cost, schedule, RFI, invoice, and safety indicators.
Delayed Projects
4
Sample demo value
Projects with schedule variance or delayed milestone signals.
Total Contract Value
$24.8M
Sample demo value
Approved contract value across the public sample dashboard.
Budget Used
68%
Sample demo value
Share of approved budget consumed in the sample view.
Actual Cost
$16.9M
Sample demo value
Current actual cost recorded in sample project data.
Estimated Profit
$3.2M
Sample demo value
Estimated remaining profit after sample cost and contract assumptions.
Profit Margin
12.9%
Sample demo value
Sample portfolio margin view for executive monitoring.
Outstanding Invoices
$1.14M
Sample demo value
Unpaid invoices requiring finance follow-up in the sample view.
Open RFIs
37
Sample demo value
Requests for information still open or awaiting response.
Pending Change Orders
14
Sample demo value
Unapproved change orders that may affect cost or schedule.
Safety Incidents
3
Sample demo value
Recorded safety events in the sample reporting period.
Equipment in Maintenance
9
Sample demo value
Equipment items unavailable or under maintenance.
Labor Cost This Month
$428K
Sample demo value
Sample monthly labor cost from approved labor or timesheet data.
Business Problem
Why construction teams need better analytics
Owners, executives, project managers, finance managers, and operations managers often need one reliable view of project performance. In practice, the data is usually scattered across accounting exports, project trackers, field reports, invoices, emails, safety reports, RFIs, and change orders.
Construction analytics does not replace project leadership. It helps teams see risk, cost movement, billing exposure, and operational signals earlier so decisions can be made with better context.
Project data lives in too many places
Cost, schedule, labor, invoices, RFIs, change orders, equipment, and safety records may sit in different spreadsheets, emails, reports, or systems.
Problems are seen too late
Owners and project managers may discover budget pressure, delayed work, open RFIs, or billing issues only after the problem has already affected delivery.
Manual reporting slows decisions
Month-end reconciliation can hide overruns, overtime, overdue invoices, and change-order exposure until leadership attention is urgent.
Operational signals stay disconnected
Labor cost, equipment downtime, safety events, and project risk are often reviewed separately from profitability and cash flow.
What this dashboard helps you monitor
Real dashboard scope depends on reporting goals, available fields, data quality, and approved access. These areas show practical construction KPI categories that can be reviewed during a custom dashboard planning session.
Project Performance
- Active projects
- Delayed projects
- Project status
- Schedule risk
- Completion percentage
Cost and Profitability
- Budget vs actual
- Committed cost
- Cost variance
- Project profit
- Profit margin
- Cost-to-complete visibility
Labor and Productivity
- Labor cost by project
- Overtime trend
- Crew allocation
- Productivity indicators
- High-cost job sites
Equipment Visibility
- Equipment utilization
- Maintenance status
- Idle equipment
- Equipment cost by project
Invoices and Cash Flow
- Outstanding invoices
- Overdue invoices
- Invoice status
- Billing delays
- Receivables visibility
RFIs and Change Orders
- Open RFIs
- Pending change orders
- Approved change orders
- Aging items
- Impact on project cost and schedule
Safety and Risk
- Incidents by month
- Incident severity
- Project safety risk
- Safety trend monitoring
Charts and Monitoring Views
Mini sample views for project, finance, and operations decisions
The images below are small sample illustrations only. They are intentionally framed inside each card so the design stays aligned on desktop and mobile.
Final chart types and values depend on verified client data.
Budget vs Actual Cost by Project
Compare approved budgets against actual project costs to identify overruns early, before they affect profitability or cash flow.
 Profit Margin by Project
See which projects are protecting margin and which jobs need cost, scope, or billing review.
Profit Margin by Project
See which projects are protecting margin and which jobs need cost, scope, or billing review.
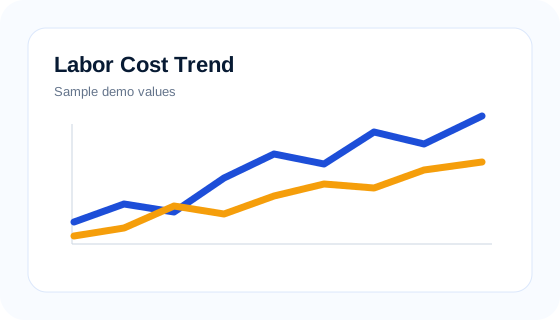 Monthly Revenue Trend
Monitor revenue movement by month so leadership can spot seasonality, billing gaps, or delayed recognition.
Labor Cost by Project
Compare labor spend across job sites to identify projects where overtime, allocation, or productivity needs review.
Project Status Distribution
Summarize projects by active, delayed, at-risk, completed, or on-hold status for executive reporting.
Safety Incidents by Month
Track incident volume over time so operations and safety teams can investigate patterns before risk grows.
Monthly Revenue Trend
Monitor revenue movement by month so leadership can spot seasonality, billing gaps, or delayed recognition.
Labor Cost by Project
Compare labor spend across job sites to identify projects where overtime, allocation, or productivity needs review.
Project Status Distribution
Summarize projects by active, delayed, at-risk, completed, or on-hold status for executive reporting.
Safety Incidents by Month
Track incident volume over time so operations and safety teams can investigate patterns before risk grows.
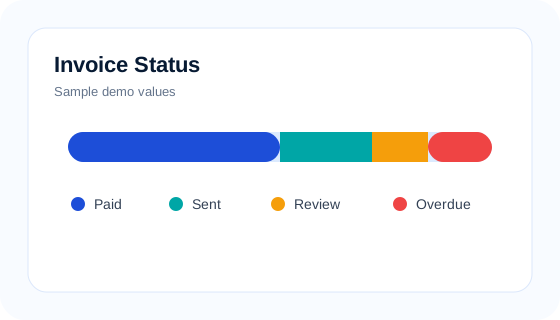 Invoice Status Summary
Show sent, paid, overdue, disputed, and draft invoices so finance teams can prioritize follow-up.
Change Order Pipeline
Monitor pending, submitted, approved, and rejected change orders to understand financial and schedule exposure.
Open RFI Aging
Group RFIs by age so project teams can prioritize the items most likely to delay decisions.
Equipment Utilization
Show active, idle, assigned, and maintenance equipment so operations can improve use of critical assets.
Cost Variance by Project
Compare budgeted cost, committed cost, and actual cost to identify jobs that need corrective action.
Overdue Invoice Tracking
Highlight unpaid balances by age, project, customer, or responsible owner to support cash-flow review.
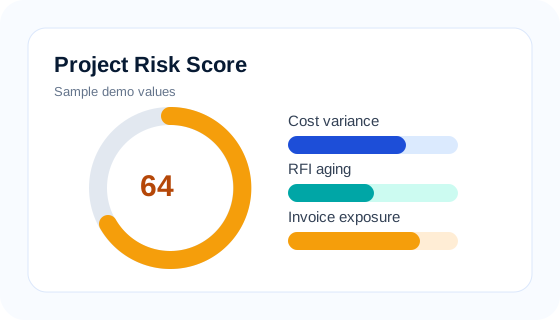
Project Risk Score
Combine cost variance, schedule delay, RFIs, change orders, invoices, and safety indicators into a simple risk view.
Labor Overtime Trend
Track overtime by week or month to understand whether project pressure is becoming a margin or safety concern.
Executive Portfolio Summary
Give owners and senior leaders one high-level view of project health, profitability, receivables, and risk.
Invoice Status Summary
Show sent, paid, overdue, disputed, and draft invoices so finance teams can prioritize follow-up.
Change Order Pipeline
Monitor pending, submitted, approved, and rejected change orders to understand financial and schedule exposure.
Open RFI Aging
Group RFIs by age so project teams can prioritize the items most likely to delay decisions.
Equipment Utilization
Show active, idle, assigned, and maintenance equipment so operations can improve use of critical assets.
Cost Variance by Project
Compare budgeted cost, committed cost, and actual cost to identify jobs that need corrective action.
Overdue Invoice Tracking
Highlight unpaid balances by age, project, customer, or responsible owner to support cash-flow review.
Project Risk Score
Combine cost variance, schedule delay, RFIs, change orders, invoices, and safety indicators into a simple risk view.
Labor Overtime Trend
Track overtime by week or month to understand whether project pressure is becoming a margin or safety concern.
Executive Portfolio Summary
Give owners and senior leaders one high-level view of project health, profitability, receivables, and risk.
Client Workflow
How a real construction dashboard is prepared
A real client version starts with use-case clarity and data readiness, not with assumptions that every system can be integrated automatically.
Start DataReady Intake
1
Discovery and Use Case Review
Understand what the company wants to monitor: cost, schedule, labor, invoices, RFIs, equipment, safety, profitability, or executive reporting.
2
Data Readiness Review
Review approved files, exports, reports, or system data to understand structure, quality, missing fields, and reporting gaps.
3
Dashboard Planning
Define KPIs, filters, user roles, project categories, reporting frequency, and executive views.
4
Dashboard Build
Prepare a private dashboard using sample-safe or client-approved data, including charts, KPI cards, project tables, and monitoring views.
5
Review and Improvement
Review with the client, adjust metrics, improve layout, and prepare a repeatable reporting workflow.
Prepared from approved exports, reports, APIs, or structured files
Real client versions can be prepared using approved exports, reports, APIs, or structured files from construction, accounting, finance, and operations workflows. Availability depends on the client's approved systems, export options, data quality, and access permissions.
Construction teams that need clearer reporting
Construction Owners
Get a clear executive view of project risk, profitability, invoices, and cash-flow exposure.
General Contractors
Monitor project health, subcontractor records, change orders, and field-operational signals.
Project Managers
Track schedule risk, RFIs, change orders, budget movement, and open actions before delays grow.
Finance Teams
Connect invoices, receivables, budget usage, cost variance, and profitability for faster review.
Operations Managers
Review labor, equipment, project status, and productivity signals across active jobs.
Estimators
Compare project performance patterns that may improve future bid, scope, and cost assumptions.
Safety Managers
Watch incident trends and project-level safety signals beside operational performance.
Small and Mid-Sized Contractors
Turn practical exports and spreadsheets into clearer reporting without overstating automation.
Specialty Contractors
Track job-specific costs, labor, invoices, and change-order exposure for focused trade workflows.
Custom Review
Want a version for your company?
Send us a short message about your construction workflow. Our analytics team can review what kind of dashboard would be useful, what data may be needed, and whether your current files are ready for analytics.
Trust and demo disclaimer
This page is a public demo using sample data. It does not display real client information. A real dashboard is created only from approved client data, files, exports, or connected systems where permission and access are provided.
DataCareerHub does not replace accounting, legal, safety, or project management responsibilities. The dashboard is designed to support visibility, reporting, and decision-making.